Although you may think of your year-end financial statements as an annual exercise to keep the IRD happy, your statements are actually a valuable resource showing how your business is performing financially. They give you the opportunity to compare financial performance from the previous year and look at ways to improve future performance.
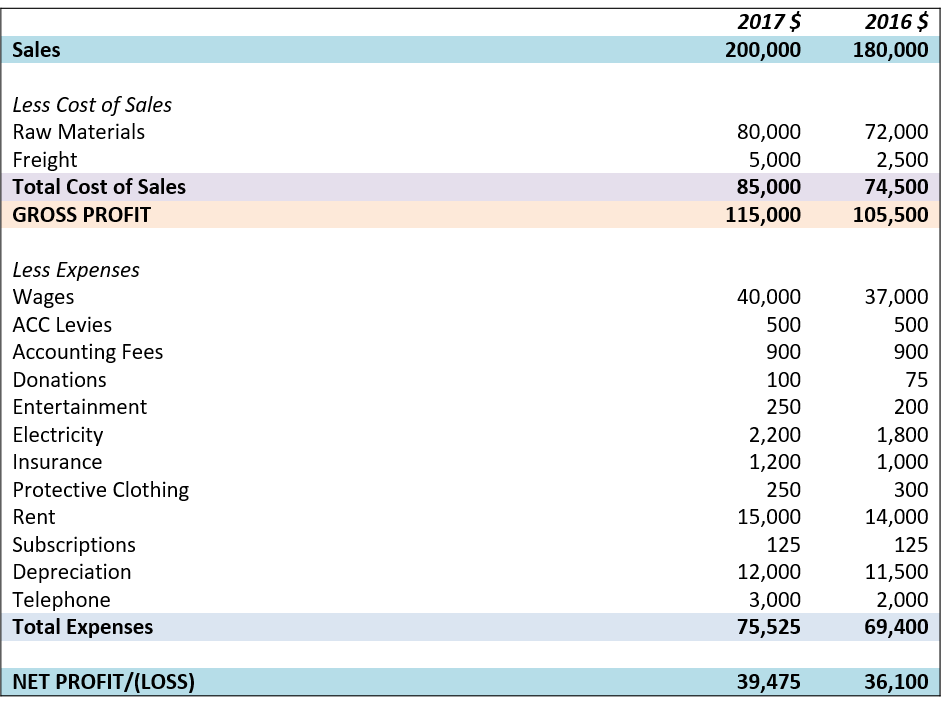
Profit and loss statements are an itemised picture of a business’ income and expenditure and are used to determine its profitability.
Income – Expenses = Net Profit/(Loss) Before Tax
Understanding Your Profit and Loss Statement (P&L)
- The P&L is used to summarise the results of a business by matching the revenue earned during a given time period with the expense incurred in earning that revenue resulting in a net profit or loss.
- The P&L is accrual based, not cash based. This means that it includes all of the revenue made and expenses incurred during that period, whether they have actually been received/paid or not.
- Revenue can be classed as either:
1) Operating revenue – income earned from activities directly related to the core activities of the business; or
2) Non-operating revenue – revenue earned from activities which are incidental to the business, for example profits from investments or the sale of assets. - Expenses can generally be classified into the following:
1) Cost of sales (or cost of goods sold) or direct costs – these are the costs incurred in acquiring goods for resale or in manufacturing goods for sale. Examples include stock, raw materials and freight.
2) Non-operating expenses or fixed costs (overhead expenses) – these are all of the other costs associated with running the business. Examples might include selling and distribution costs such as advertising, commissions and salespeople, administration costs such as accounting fees, telephone expenses, rent and rates, and financial expenses such as interest and bank fees. - The P&L does not include any loans or loan principal repayments. It does include interest on loans as this is an (non-operating) expense.
How To Use the P&L
Gross Profit
Calculated by dividing the gross profit figure by sales (as a percentage), your gross profit margin reflects the percentage of each dollar of revenue that is left after accounting for the cost of sales. Gross profit margins vary by industry, and it is useful to compare your figure with industry averages to see if you are overpricing or under-pricing compared to your competitors.
As we explained, the costs/expenses are separated into two categories: direct costs (cost of sales) and non-operating expenses (overheads). This is important because direct costs are variable, i.e. they vary depending on your sales. Higher sales equals higher cost of goods. Reviewing your gross profit – and comparing it to the previous year – tells you about your business’ profitability. For example, if your business involves freight and fuel prices rise significantly you are likely to see an increase in the cost of goods compared to sales, resulting in a lower gross profit margin. You could then look at ways to address this such as raising your prices to compensate for the higher fuel costs.
Expenses To Sales Ratio
Non-operating expenses are largely fixed costs incurred with the general running of your business, and it is useful to calculate these as a percentage of sales. Assuming your non-operating expenses remain fairly consistent, any increase in sales can result in increased net profit, and likewise any drop in sales will reduce your net profit. The non-operating expenses should also be examined every year to identify any major increases and give you the opportunity to make reductions. For example, if your mobile phone costs have increased significantly you could look at alternative packages or suppliers for a better deal. Or if your postage costs have risen sharply you could email out all invoices and statements instead of posting them.
Other Ratios
You can use P&L statements to calculate other useful ratios and determine whether these are increasing or decreasing in proportion to changes in sales. For example, calculating marketing expenses as a percentage of sales is an indication of how effective your marketing strategies are from one year to the next. The ratio of wages to sales can tell you if wages are changing disproportionately compared to sales, and gives you the opportunity to delve deeper into this area.
Please contact us if you have any questions regarding your profit and loss statement and how you can use it to understand and improve your business’ profitability. For more information on understanding your financial statements, see our previous article “The Beginner’s Guide To Understanding Your Balance Sheet“.